01
Open or sign in
Use the live demo with no account — three symbols, all 34 widgets — or sign in for every symbol and saved layouts.
Build a live monitoring screen from 34 widgets covering price, technical indicators, economic events, screeners and cross-market analytics. Start from a built-in layout, customize the canvas, save your workspace and switch the entire view across seven timeframes.
Market Monitor is the application layer on top of TickAtlas. It brings quotes, indicators, calendar events, screeners and cross-market views into one configurable workspace, while the underlying data stays available through the API for your own software.
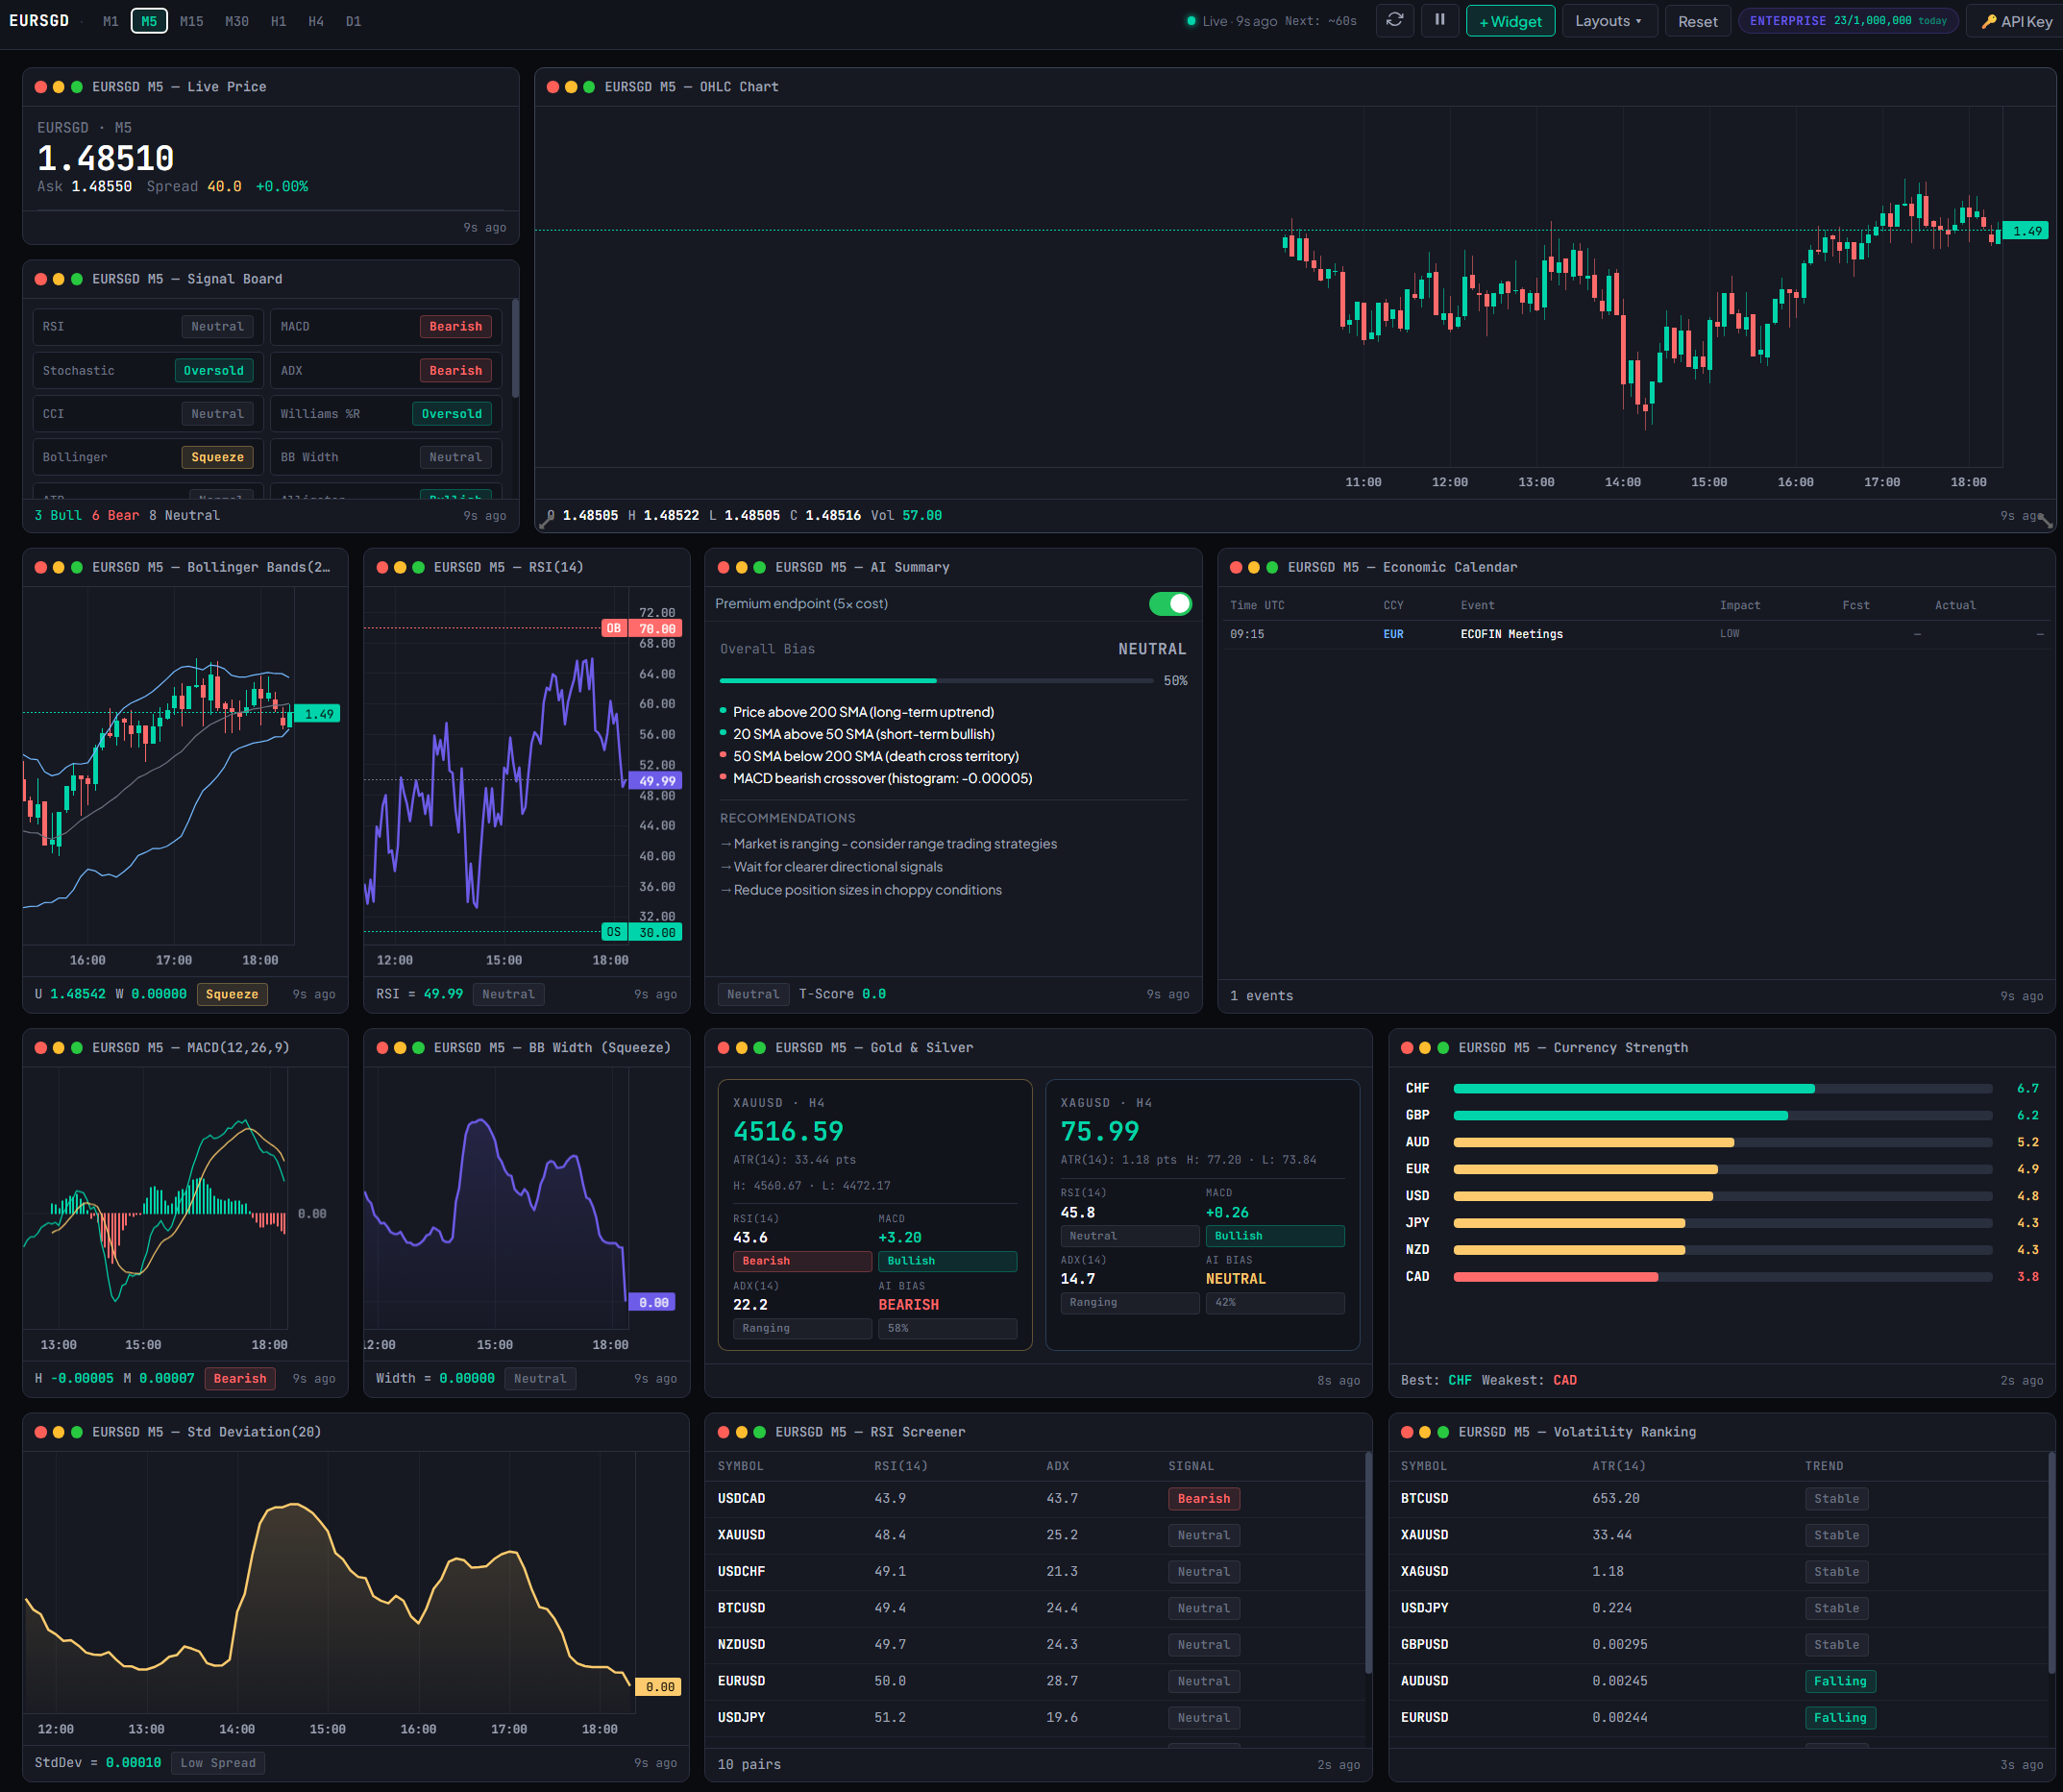
No desktop install and no data connector. Start with the hosted monitor, choose a layout, add the widgets you need and let the workspace remember your state.
Use the live demo with no account — three symbols, all 34 widgets — or sign in for every symbol and saved layouts.
Start from Default, Trader, Screener, Metals or AI Dashboard instead of staring at an empty canvas.
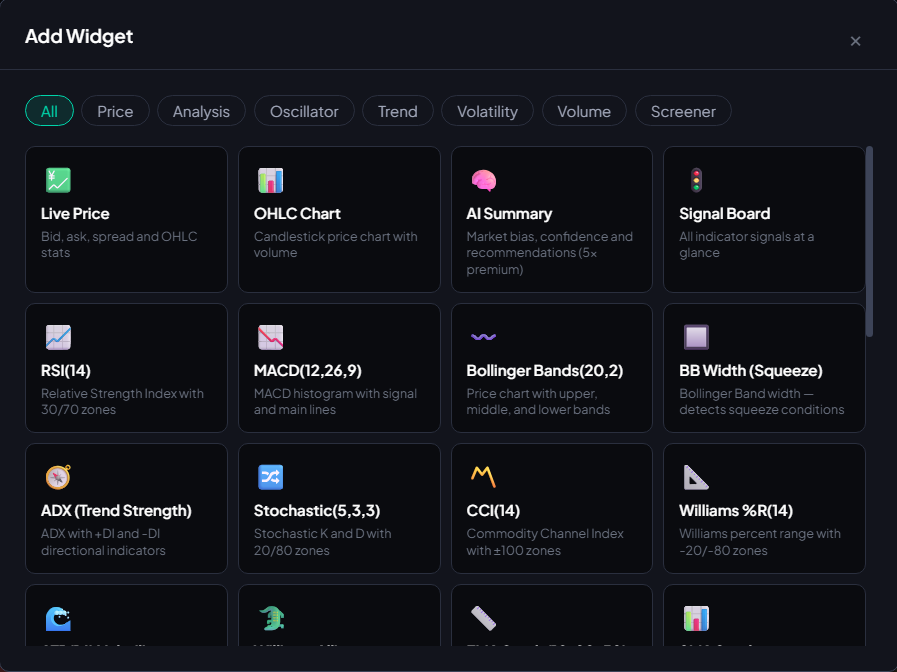
Pick from 34 widgets across 7 categories, then drag and resize them into the view that makes sense for you.
Switch symbol and timeframe from one place. Pause or refresh the workspace when you want control over credit consumption.
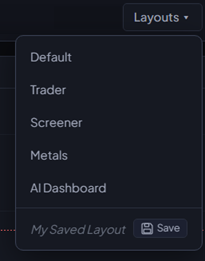
The built-in layouts are deliberately opinionated starting points. Use one as-is, modify it, or save a custom arrangement to your account — there is no cap on how many you keep.
A balanced starter view — price, chart, and the main oscillators side by side.
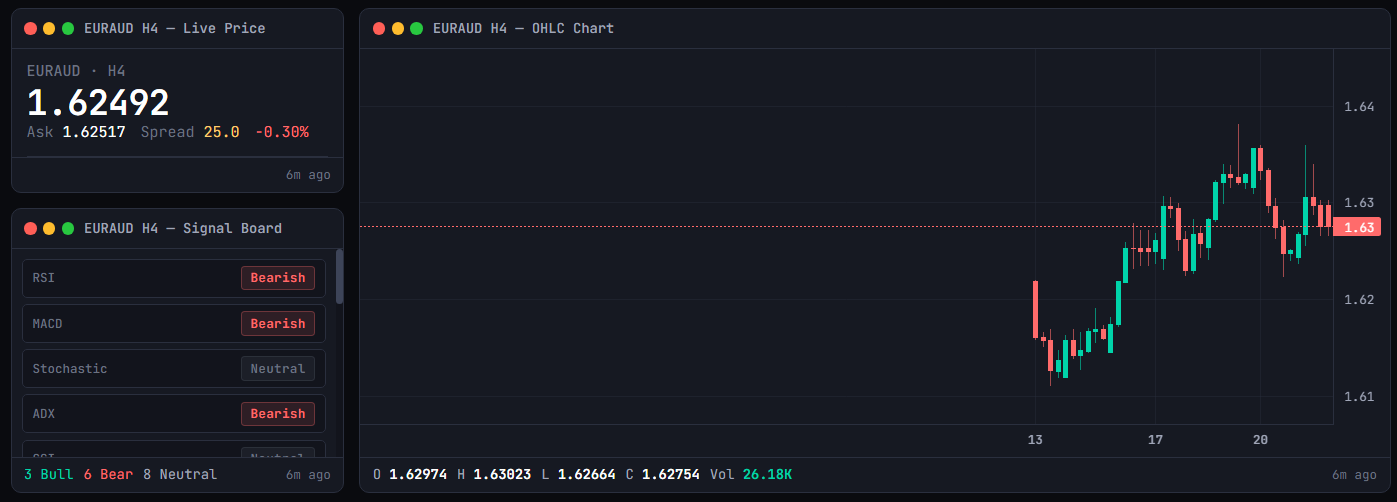
Discretionary FX/CFD setup. Live price, OHLC chart, the Signal Board, and a tight indicator stack.
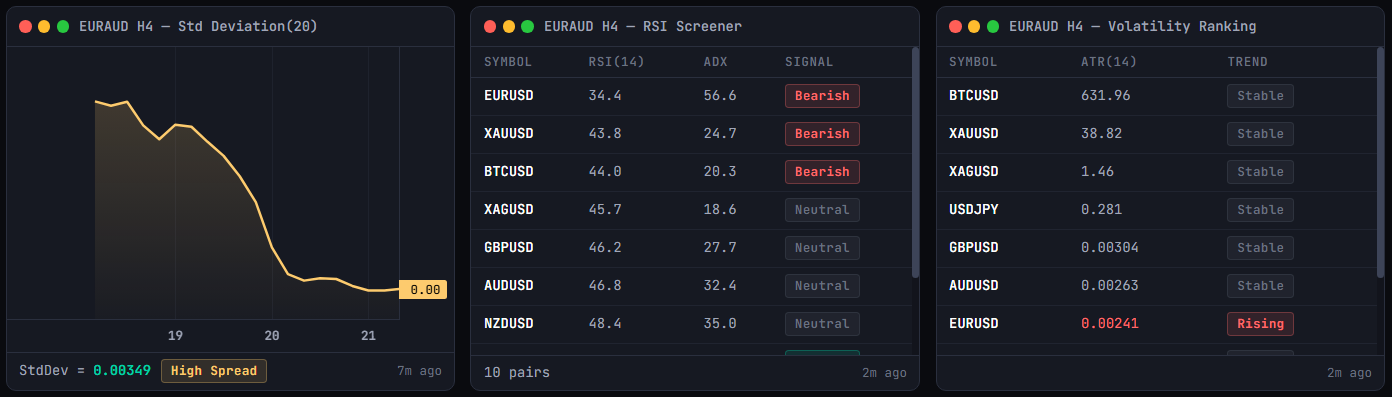
Scan-driven workflow. The RSI Screener, Volatility Ranking, and Currency Strength panel take centre stage.
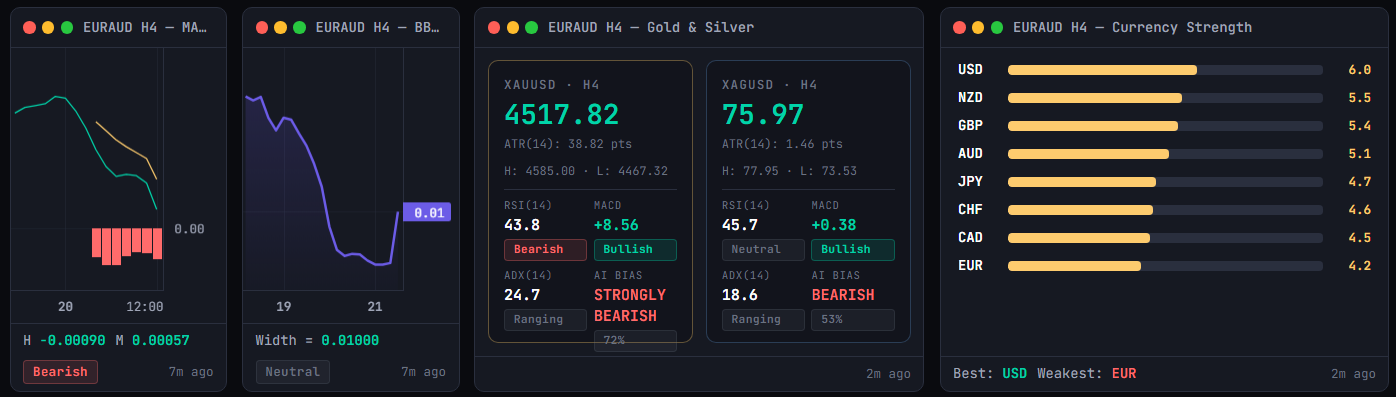
Gold and silver dashboards. XAUUSD and XAGUSD pricing with ATR, MACD, RSI, ADX, and a bias readout.
The AI Summary widget headlines, with Signal Board, Economic Calendar, and supporting indicators around it.
From raw price and economic events to trend, volatility, volume and cross-symbol screeners, the widget library covers the same data surfaces that sit behind the TickAtlas API. Every widget links to its own documentation.
Quotes, candles, spreads — the raw market.
High-level bias, sentiment, and cross-indicator confluence.
Bounded indicators — find extremes, divergences, reversals.
Direction, slope, and trend-strength tools.
Squeezes, ranges, and the size of moves.
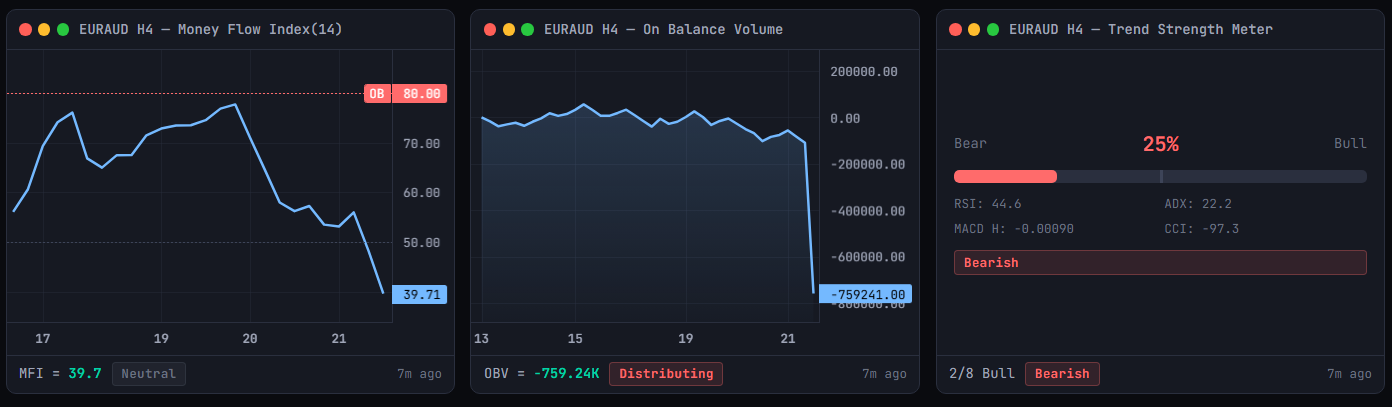
Money flow, accumulation, distribution.
Cross-symbol scans, ranked inline.
New widgets ship regularly — see the changelog for the latest additions.
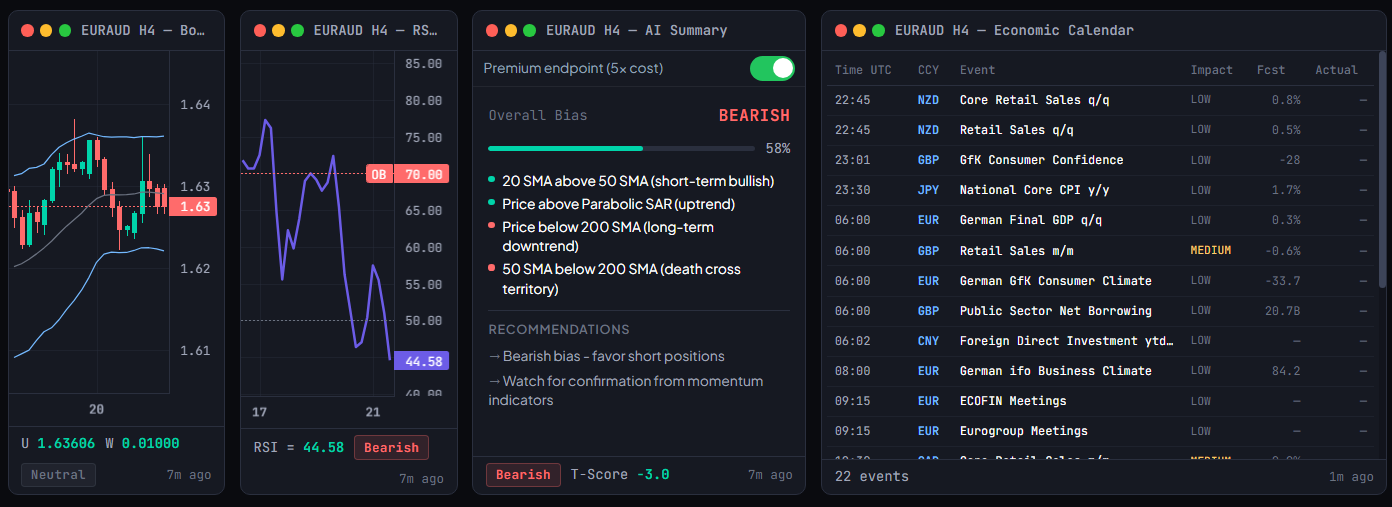
A few widgets show the range particularly well: event context, aggregated indicator state and cross-symbol ranking sit next to raw price without feeling like separate products.
Condensed market state: an overall bias, a confidence bar, a T-score and the weighted bullish and bearish signals behind the result. Every tier can run it, including the demo — each refresh costs five standard credits, and it ships with an off-by-default toggle.
Collapses RSI, MACD, Stochastic, ADX, CCI and the rest of the oscillator suite into one column, each row tagged bullish, bearish or neutral, with a running tally at the foot — so agreement is visible without opening every indicator separately.
Upcoming releases with UTC time, currency, event name, impact rating, forecast and actual. Useful when a data workspace needs event context sitting beside the technical views.
/v1/screener endpoint
your scripts call.
The interface is built around one principle: make the workspace feel responsive without polling any data source more often than its timeframe justifies.
The canvas is a GridStack v9 grid. Drag widgets to reorder, grab a corner to resize. Layouts persist to your account.
Monitor Pro streams sidebar symbol prices over WebSocket the second they tick, and so do Starter, Pro and Enterprise. On pay-as-you-go and the demo the dashboard refreshes on a timer, so you keep control of credit cost.
The dashboard refreshes M1 every 60 s, but H4 every 30 min — there is no value polling slower data faster than it changes.
Active symbol, timeframe, and layout persist to local storage. Refresh the tab and you land back exactly where you were.
Market Monitor polls on a different default interval per timeframe. That keeps short-term views responsive without spending credits on slow-changing candles that do not need constant polling. Pausing the dashboard stops consumption entirely.


Market Monitor is not a separate data silo. The same platform exposes market data and analytics over REST, so your internal tools, agents and applications can work with the data directly.
# the same RSI value the widget displays
curl -H "X-API-Key: YOUR_API_KEY" \
  "https://tickatlas.com/v1/indicator?symbol=EURUSD&indicator=RSI_14&timeframe=H1"

# documented example response
{
  "symbol": "EURUSD",
  "indicator": "RSI_14",
  "timeframe": "H1",
  "value": 58.43,
  "bid": 1.0856,
  "ask": 1.0857,
  "updated_at": 1711548000,
  "server_time": "2024-03-27T14:00:00+00:00"
}Open the read-only demo with no signup, create an account for your own monitor, or move to Monitor Pro for real-time streaming. There is no free tier and no trial — every tier, demo included, gets all 34 widgets.
The positioning is not "another charting terminal." It is a configurable interface to the same data platform your software can already consume.
A live single-screen view of the pairs you’re working — price, OHLC, signal aggregation, and the short list of indicators you trust.
Hunting setups across the whole symbol universe? The dashboard’s Screener category widgets bring cross-symbol results inline with single-symbol analysis.
Majors and metals together. The Gold & Silver and Currency Strength widgets are built for exactly this; the Metals layout is a one-click starting point.
Practical details about the workspace, what a refresh costs, and how the dashboard relates to the rest of the API.
Yes — the dashboard authenticates against your TickAtlas account and uses your account’s API key behind the scenes. If you don’t have one yet, sign up and one is created for you.
Each widget consumes API credits at the same rate as a direct call to the underlying endpoint. The AI Summary widget is the only premium one — it consumes 5× a standard request per refresh. Pausing the dashboard pauses credit consumption.
Yes. Once you’ve arranged a layout, hit Save and it joins the dropdown as "My Saved Layout." There’s no hard limit on the number of custom layouts per account.
M1, M5, M15, M30, H1, H4, and D1 — the same seven timeframes the rest of the TickAtlas API exposes. Every widget on the canvas re-renders when you switch.
Our data — the same that powers the TickAtlas REST API — OHLCV, ticks, indicators, calendar, and the Screener endpoint. Real-time data is cached with a short TTL for fast delivery.
Yes, in two ways. First, you can put cross-symbol widgets on the canvas — Currency Strength, RSI Screener, Volatility Ranking, Gold & Silver. Second, you can have multiple Market Monitor tabs open, each on its own symbol.
No. The demo opens with no account at all, and signing up puts you on pay-as-you-go with $2.50 of credit — there is no free tier and no trial. Every tier, including the demo, gets all 34 widgets and the AI Summary widget. Monitor Pro adds real-time WebSocket streaming.
Start with the live demo, explore the widget library, and decide whether you want the data as a dashboard, as an API integration, or both.